Line
Add chart method present in slide component or you can replace the chart using shape component.
Basic Code Sample
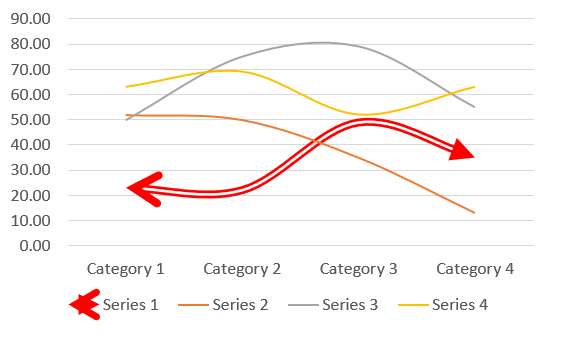
// Bare minimumpowerPoint.AddSlide(PresentationConstants.SlideLayoutType.BLANK) .AddChart(CreateDataCellPayload(), new G.LineChartSetting<G.PresentationSetting>());// Some additional samplespowerPoint.AddSlide(PresentationConstants.SlideLayoutType.BLANK) .AddChart(CreateDataCellPayload(), new G.LineChartSetting<G.PresentationSetting>() { lineChartSeriesSettings = new(){ new(){ lineChartLineFormat = new(){ dashType = G.DrawingPresetLineDashValues.DASH_DOT, lineColor = "FF0000", beginArrowValues= G.DrawingBeginArrowValues.ARROW, endArrowValues= G.DrawingEndArrowValues.TRIANGLE, lineStartWidth = G.LineWidthValues.MEDIUM, lineEndWidth = G.LineWidthValues.LARGE, outlineCapTypeValues = G.OutlineCapTypeValues.ROUND, outlineLineTypeValues = G.OutlineLineTypeValues.DOUBLE, width = 5 } } } });LineChartSetting<G.PresentationSetting> Options
Contains options details extended from ChartSetting that are specific to line chart.
| Property | Type | Details |
|---|---|---|
| lineChartDataLabel | LineChartDataLabel | General Data label option applied for all series |
| lineChartSeriesSettings | List<LineChartSeriesSetting?> | Data Series specific options are used from the list. The position on the list is matched with the data series position. you can use null to skip a series |
| lineChartTypes | LineChartTypes | Type of chart |
| chartAxesOptions | ChartAxesOptions | Chart axes options |
LineChartDataLabel Options
Contains options details extended from ChartDataLabel that are specific to line chart.
| Property | Type | Details |
|---|---|---|
| dataLabelPosition | DataLabelPositionValues | Data Label placement options. |
LineChartSeriesSetting Options
Contains options details extended from ChartSeriesSetting that are specific to column chart.
| Property | Type | Details |
|---|---|---|
| lineChartDataLabel | LineChartDataLabel | Data Label Option specific to one series |
| lineChartLineFormat | LineChartLineFormat | |
| lineChartDataPointSettings | List<LineChartDataPointSetting?> | TODO |
LineChartLineFormat Options
| Property | Type | Details |
|---|---|---|
| transparency | int? | |
| width | int? | |
| outlineCapTypeValues | OutlineCapTypeValues? | |
| outlineLineTypeValues | OutlineLineTypeValues? | |
| beginArrowValues | DrawingBeginArrowValues? | |
| endArrowValues | DrawingEndArrowValues? | |
| dashType | DrawingPresetLineDashValues? | |
| lineStartWidth | LineWidthValues? | |
| lineEndWidth | LineWidthValues? |