Bar
Add chart method present in slide component or you can replace the chart using shape component.
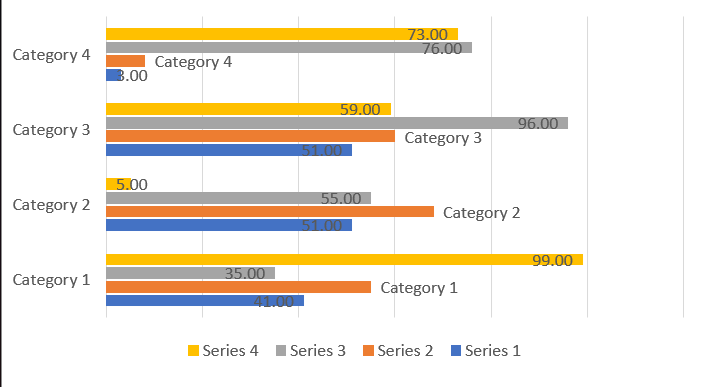
Basic Code Sample
// Bare minimumpowerPoint.AddSlide(PresentationConstants.SlideLayoutType.BLANK) .AddChart(CreateDataCellPayload(), new G.BarChartSetting<G.PresentationSetting>());// Some additional samplespowerPoint.AddSlide(PresentationConstants.SlideLayoutType.BLANK) .AddChart(CreateDataCellPayload(), new G.BarChartSetting<G.PresentationSetting>() { chartAxesOptions = new() { isHorizontalAxesEnabled = false, }, barChartDataLabel = new G.BarChartDataLabel() { dataLabelPosition = G.BarChartDataLabel.DataLabelPositionValues.INSIDE_END, showValue = true, }, barChartSeriesSettings = new(){ new(), new(){ barChartDataLabel = new G.BarChartDataLabel(){ dataLabelPosition = G.BarChartDataLabel.DataLabelPositionValues.OUTSIDE_END, showCategoryName= true } } } });BarChartSetting<G.PresentationSetting> Options
Contains options details extended from ChartSetting that are specific to bar chart.
| Property | Type | Details |
|---|---|---|
| barChartDataLabel | BarChartDataLabel | General Data label option applied for all series |
| barChartSeriesSettings | List<BarChartSeriesSetting?> | Data Series specific options are used from the list. The position on the list is matched with the data series position. you can use null to skip a series |
| barChartTypes | BarChartTypes | Type of chart |
| chartAxesOptions | ChartAxesOptions | Chart axes options |
| barGraphicsSetting | BarGraphicsSetting | Set properties related to bar placement |
BarChartDataLabel Options
Contains options details extended from ChartDataLabel that are specific to bar chart.
| Property | Type | Details |
|---|---|---|
| dataLabelPosition | DataLabelPositionValues | Data Label placement options. |
barChartSeriesSetting Options
Contains options details extended from ChartSeriesSetting that are specific to bar chart.
| barChartDataLabel | BarChartDataLabel | Data Label Option specific to one series |
| fillColor | string? | Fill color specific to one series |
| barChartDataPointSettings | List<BarChartDataPointSetting?> | Data point specific options are used from the list. The position on the list is matched with the data point position. you can use null to skip a data point. |
BarGraphicsSetting Options only applied in cluster type
| Property | Type | Details |
|---|---|---|
| categoryGap | int | Gap between Category. Default : 219 |
| seriesGap | int | Gap between Series. Default : -27 |
BarChartDataPointSetting Options
Contains options details extended from ChartDataPointSetting that are specific to bar chart.