
This content is for v4.x (Alpha). Switch to the Stable version.
Bar
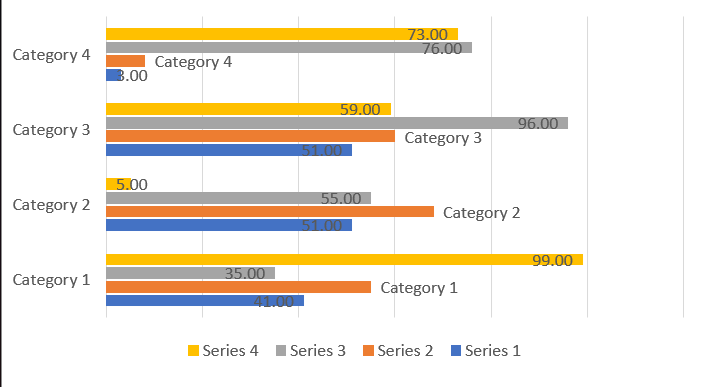
Add chart method present in slide component or you can replace the chart using shape component.
Basic Code Sample
Section titled “Basic Code Sample”// Bare minimumpowerPoint.AddSlide(PresentationConstants.SlideLayoutType.BLANK) .AddChart(CreateDataCellPayload(), new G.BarChartSetting<G.PresentationSetting>());// Some additional samplespowerPoint.AddSlide(PresentationConstants.SlideLayoutType.BLANK) .AddChart(CreateDataCellPayload(), new G.BarChartSetting<G.PresentationSetting>() { chartAxesOptions = new() { isHorizontalAxesEnabled = false, }, barChartDataLabel = new G.BarChartDataLabel() { dataLabelPosition = G.BarChartDataLabel.DataLabelPositionValues.INSIDE_END, showValue = true, }, barChartSeriesSettings = new(){ new(), new(){ barChartDataLabel = new G.BarChartDataLabel(){ dataLabelPosition = G.BarChartDataLabel.DataLabelPositionValues.OUTSIDE_END, showCategoryName= true } } } });BarChartSetting<G.PresentationSetting> Options
Section titled “BarChartSetting<G.PresentationSetting> Options”Contains options details extended from ChartSetting that are specific to bar chart.
| Property | Type | Details |
|---|---|---|
| barChartDataLabel | BarChartDataLabel | General Data label option applied for all series |
| barChartSeriesSettings | List<BarChartSeriesSetting?> | Data Series specific options are used from the list. The position on the list is matched with the data series position. you can use null to skip a series |
| barChartTypes | BarChartTypes | Type of chart |
| chartAxesOptions | ChartAxesOptions | Chart axes options |
| barGraphicsSetting | BarGraphicsSetting | Set properties related to bar placement |
BarChartDataLabel Options
Section titled “BarChartDataLabel Options”Contains options details extended from ChartDataLabel that are specific to bar chart.
| Property | Type | Details |
|---|---|---|
| dataLabelPosition | DataLabelPositionValues | Data Label placement options. |
barChartSeriesSetting Options
Section titled “barChartSeriesSetting Options”Contains options details extended from ChartSeriesSetting that are specific to bar chart.
| barChartDataLabel | BarChartDataLabel | Data Label Option specific to one series |
| fillColor | string? | Fill color specific to one series |
| barChartDataPointSettings | List<BarChartDataPointSetting?> | Data point specific options are used from the list. The position on the list is matched with the data point position. you can use null to skip a data point. |
BarGraphicsSetting Options only applied in cluster type
Section titled “BarGraphicsSetting Options only applied in cluster type”| Property | Type | Details |
|---|---|---|
| categoryGap | int | Gap between Category. Default : 219 |
| seriesGap | int | Gap between Series. Default : -27 |
BarChartDataPointSetting Options
Section titled “BarChartDataPointSetting Options”Contains options details extended from ChartDataPointSetting that are specific to bar chart.